Commodities Update September 2026
Most commodities rose in August, with our broadest commodities index increasing 4.5%mth as the geopolitical risk premium reasserted itself. LNG led gains, rising 15.9%mth, while gold increased 8.4%mth, copper 5.5%mth, Brent 5.0%mth and aluminium 3.1%mth. In contrast, steelmaking commodities weighed on the headline index, with iron ore falling 2.0%mth and Queensland premium low-vol coking coal declining 3.3%mth, while lithium (spodumene) fell 4.7%mth.
The following is based on text from the September Market Outlook (PDF 3MB)
For more details of our longer-term forecasts see September Commodity Forecasts
Most commodities rose in August as the geopolitical risk premium reasserted itself. Our broadest commodities index increased 4.5%mth, led by LNG, which rose 15.9%mth on ongoing market tightness and renewed Middle East tensions. Gold gained 8.4%mth, supported by more favourable US economic data and US Treasury intervention in the long end of the bond market, while copper rose 5.5%mth as COMEX inventories continued to build. Brent gained 5.0%mth amid renewed hostilities in the Middle East, aluminium increased 3.1% and Newcastle thermal coal rose 0.8%mth. In contrast, steelmaking commodities weighed on the headline index, with iron ore and Queensland premium low-vol coking coal falling 2.0%mth and 3.3%mth respectively, while lithium (spodumene) declined 4.7%mth.
Oil prices rebound as tensions build
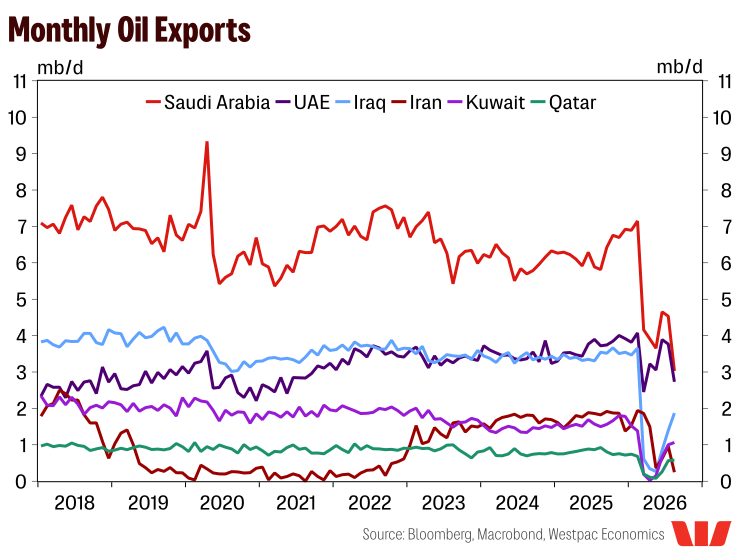
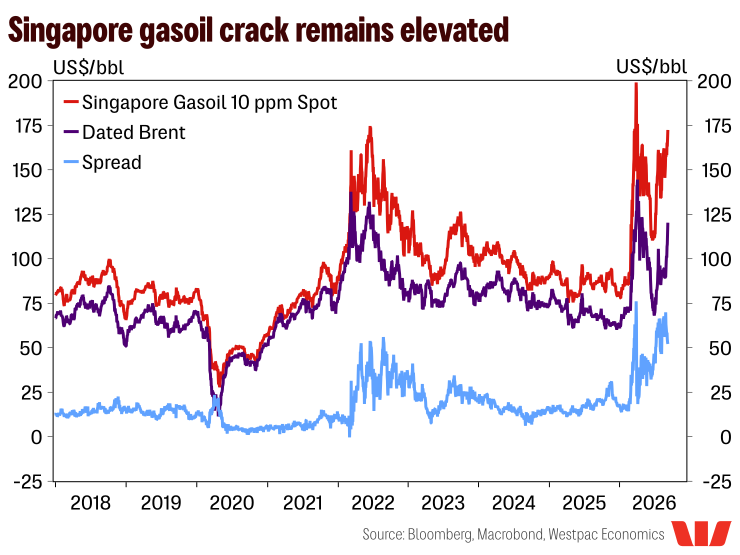
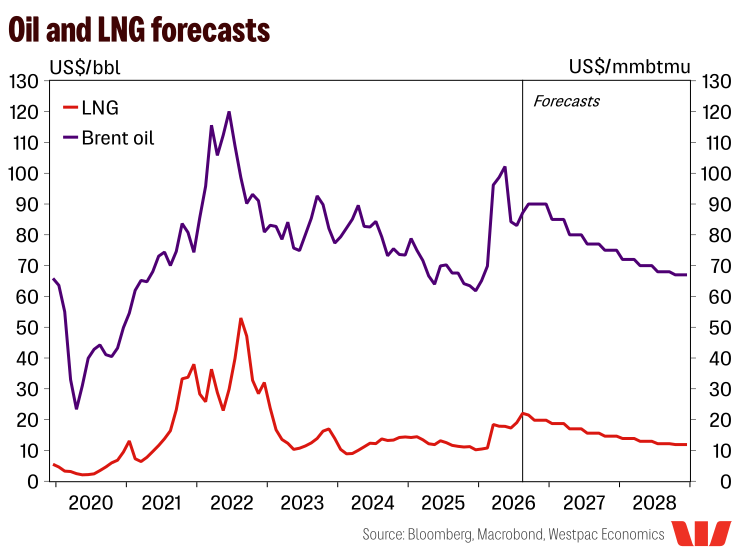
The price of Brent averaged US$87.1/bbl in August, up 5.0%mth and the highest monthly average since May. The increase came as hopes of a lasting agreement between the US and Iran faded, with tensions building throughout the month resulting in periodic flare-ups, as we had previously flagged as a key risk. Ongoing Houthi targeting of Saudi loading ports in the Red Sea has damaged infrastructure and extended delivery times, contributing to Saudi crude exports falling to their lowest level since the conflict began. Another important source of price support has been Ukraine's successful targeting of Russian production and refining capacity, resulting in the Russian government forecasting oil production for 2026 at its lowest level since 2009. The attacks have had a particularly pronounced impact on refined product markets, where strong demand, supply shortfalls and depleted inventories were already present. Singapore Gasoil margins rose to their highest level since April in early September at around US$70/bbl, up from roughly US$15/bbl prior to the conflict – posing upside risk to domestic fuel prices. The continued disruption to physical crude availability has prompted us to revise our Q4 Brent forecast to US$90/bbl, a roughly 11% increase on our previous baseline.
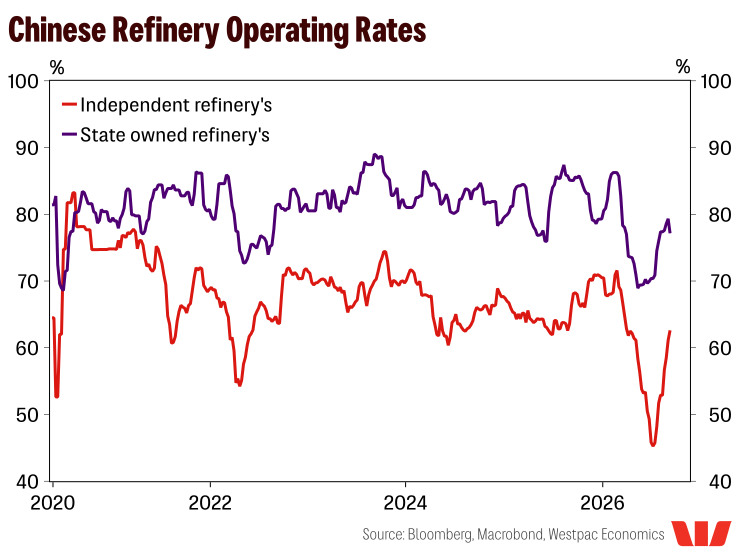
We continue to expect volatility, with key differences between the US and Iran remaining unresolved while supply and demand fundamentals will increasingly reassert themselves as key drivers of prices over coming months. Notably, inventories remain very low. EIA statistics suggest total OECD inventories in August are 121mb below levels recorded prior to the start of the conflict in February. The need to rebuild these depleted reserves is expected to support demand going forward. China is also likely to become a more important source of demand, with lower Chinese imports having been a key buffer against the global supply shock, although this support is unlikely to persist. In August, China accounted for just under 14% of global seaborne crude imports, down from just below 21% a year earlier. At the same time, independent refinery operating rates continue to recover from recent historic lows, although remained constrained by lack of access to cheap Iranian crude. We expect Chinese demand to strengthen through Q4 as refiners begin restocking ahead of Chinese New Year. Overall, we expect Brent to average US$90/bbl for the remainder of 2026 as Middle East tensions remain unresolved and Chinese demand continues to recover. Volatility will remain a feature, with much depending on the durability of any ceasefire and the pace of normalisation in shipping through the Strait, as captured in the two scenarios we published in June.
LNG markets remain tight
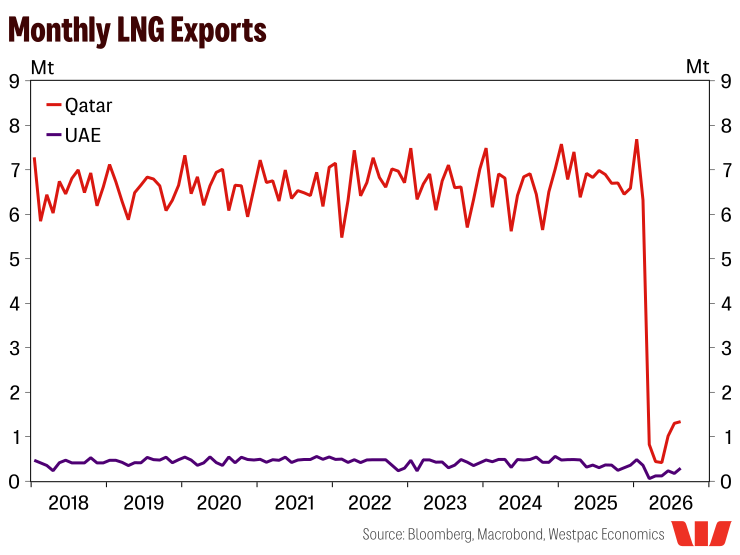
LNG prices continued to climb through August. Damage to the world’s largest LNG export complex at Ras Laffan in Qatar and the inability to divert flows around the Strait of Hormuz continue to weigh on supply. These constraints have been compounded by strong summer cooling demand across Northeast Asia. Competition with Europe for flexible Atlantic Basin cargoes has also intensified, with maintenance at Freeport LNG, one of the US' largest LNG export facilities, further reducing available supply throughout August. As a result, Japanese LNG prices rose 15.9%mth in August, with average prices reaching US$22.0/mmbtu, more than double pre‑conflict levels.
We have raised our expected peak in Japanese LNG prices to average US$21.5/mmbtu in the September quarter. Supply recovery is expected to remain constrained, with prices unlikely to return to pre‑conflict levels until 2028. Domestically, however, the Australian gas market remains relatively insulated, supported by the FY2027 Federal Budget's domestic gas reservation scheme, which requires exporters to supply the equivalent of up to 20% of gas exports to the Australian market. The government has an objective of putting a cap on domestic gas at around $12 gigajoule.
Shanxi disruption supports seaborne coal
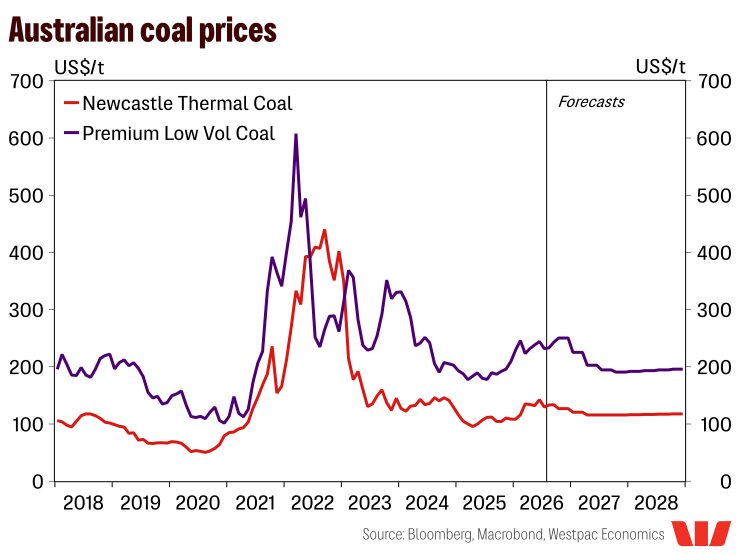
Newcastle thermal coal prices were little changed in August, averaging US$131/t over the month, up 0.8%mth from July. Key sources of support remain in place, keeping prices well above pre‑conflict levels. LNG markets continue to support the relative cost competitiveness of thermal coal, while shifting energy security priorities across Japan, South Korea and Taiwan have driven greater coal procurement as a hedge against LNG supply disruption. China has also emerged as a stronger seaborne buyer, reflecting tighter domestic supply following the Shanxi mining disaster. Prices have since risen sharply in early September, approaching US$150/t, supported by still‑elevated LNG prices and diesel shortages in Russia, which have constrained coal exports, while India's return to the seaborne thermal coal market ahead of winter restocking should also be supportive. Against this backdrop, we now expect Newcastle thermal coal to average US$127/t in the December quarter before easing towards US$116/t through 2027 as global energy prices recede. Over the longer term, prices are expected to rise as ongoing demand outpaces supply growth, with mine depletion, regulatory hurdles, community opposition and financing constraints limiting new capacity, particularly in Australia.
Queensland premium low-vol coking coal prices fell 3.3%mth in August. The decline reflected ample seaborne supply, particularly from Australia, while Chinese and Indian demand remained relatively weak. Since then, however, prices have reversed sharply, with Queensland premium low-vol coking coal rising above US$270/t in early September, its highest level since March 2024. The move higher largely reflects the ongoing supply disruption stemming from the gas explosion at a coking coal mine in Shanxi province in late May, with resulting production suspensions and safety inspections proving more persistent than expected. While the resulting supply loss was initially expected to be offset by increased Mongolian imports, diesel shortages in Mongolia have constrained coal production, with disruption likely to persist for some time. This prompted China to return to the seaborne market, with Australia emerging as a major beneficiary. Indian demand is also gradually returning as the country emerges from the monsoon season and steel production lifts. However, comfortable port inventories and weak steelmaking margins are expected to limit the overall strength of this demand impulse. As a result, we forecast premium low-vol coking coal prices to maintain strength into the December quarter averaging US$250/t as diesel shortages in Mongolia continue to constrain supply, with prices moderating into 2027.
Iron ore under pressure as supply builds
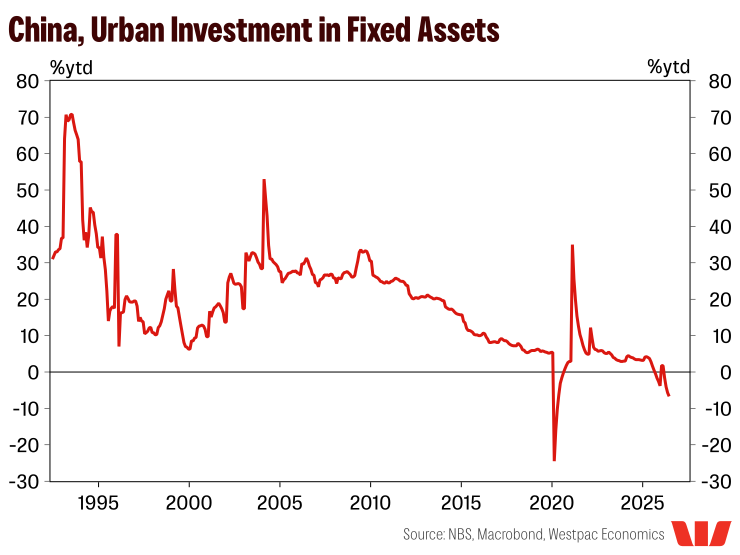
Iron ore prices (62% Fe index) softened 2.0%mth in August, further slipping below US$100/t to average US$97.6/t. August's result largely reflects themes that have persisted in recent months. Seaborne supply remains strong across major exporting regions, including Australia, Brazil and the continued ramp-up of Simandou in Guinea. At the same time, the Shanxi mining disaster has kept coking coal markets especially tight, further compressing steelmaker margins that were already under pressure from intense competition between mills and weighing particularly on demand for lower-grade ores. China's domestic economy also presents limited upside, with urban fixed asset investment down 6.7%ytd in July. As a result, iron ore inventories at Chinese ports remain historically elevated.
Some support continues to come from strong exports, which have acted as an outlet for excess supply. Chinese exports of steel and iron products remained above 10Mt in August, marking a fourth consecutive month above this threshold, while hopes for additional domestic steel demand during the traditional September-October peak season have also supported prices. A more significant source of support has been elevated capesize freight rates, with freight accounting for an estimated 15-30% of delivered costs. Shipping futures from Western Australia to Qingdao have continued to rise, reaching their highest level in September since the start of the Middle East conflict (+90% above pre-conflict levels). As a result, we expect the 62% Fe index to average US$97/t in the December quarter. There are many uncertainties when it comes to the impact of a larger than usual El Nino event, including the possibility of above-average rainfall across southern and eastern China that may disrupt construction activity and so presents an additional downside risk.
The medium-term outlook is becoming increasingly challenging, with surplus conditions expected to emerge. Supply-side pressures are building as new low-cost output from Simandou enters the market, with Wood Mackenzie estimating export volumes could more than double to 40Mt in 2027. Persistently high inventories in China and softer global steel demand, as major economies contend with elevated energy costs, are expected to place further downward pressure on prices. Increased scrap usage and the ongoing structural decline in Chinese steel production are also eroding underlying demand, with growth in India and South-East Asia, supported by urbanisation and population growth, providing only a partial offset. We therefore expect iron ore prices to soften further, averaging around US$83/t in the December quarter of 2027, as surplus conditions become more evident.
Gold finds support on falling bond yields
Gold returned to form in August, rising 8.4%mth and re-establishing a monthly average above US$4,400/oz. As a non-yielding asset, gold has faced a notable rotation throughout the conflict as markets weighed the inflationary implications of Middle East tensions and the prospect that central banks may need to accelerate rate hiking cycles. However, dip-buying, together with a benign US core CPI print in July and a surprise US Treasury announcement to at least double long-end bond buyback operations, helped ease Fed hike expectations and lower yields, supporting gold prices.
While the flow of US economic data will remain critical in determining the outlook for gold, and a rate hike by the US Fed in September is likely to result in a modest short-lived correction, the broader backdrop remains supportive. Gold's relatively muted response to recent developments is telling, suggesting investors are increasingly looking beyond the next data release and the opportunity cost of holding a non-yielding asset. Instead, attention appears to be shifting towards the role gold can play in making portfolios more resilient to an unusually broad mix of macroeconomic, policy and geopolitical risks. Additional support may also emerge around the US midterm elections, where safe-haven demand could strengthen.
We therefore expect modest gains through the remainder of 2026, with a December quarter average of US$4,500/oz, followed by a period of consolidation in early 2027 as brownfield expansions at existing operations lift supply in response to recent high prices. Over the longer term, while volatility is likely to remain tied to broader financial market moves, structural support should persist. Ongoing Asian demand, driven by the region's growing role in global gold trading, investment and physical distribution, should open the market to a broader pool of investors, while US fiscal and currency concerns, together with continued central bank buying and reserve diversification, are expected to provide additional support.
Tariff uncertainty drives the outlook for copper
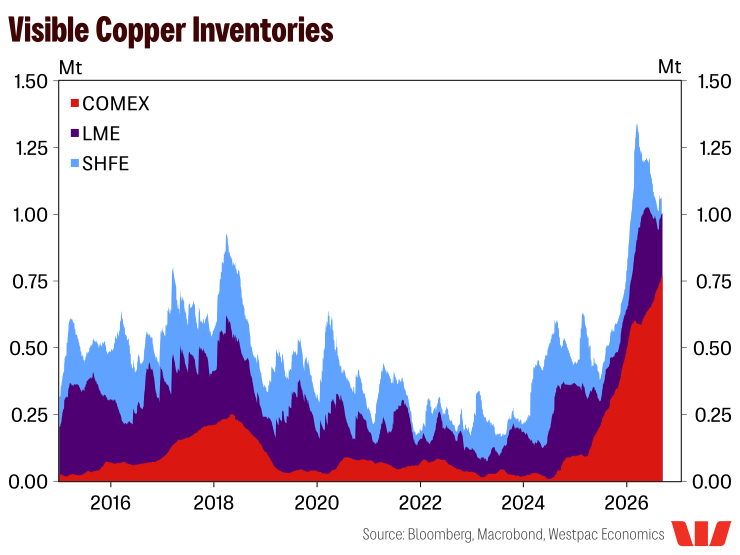
Copper prices posted a solid gain in August, rising 5.5%mth. The increase was again driven primarily by COMEX inventory building as markets positioned ahead of delayed announcements regarding Section 232 tariffs. COMEX inventories rose a further 6.7%mth across the August average, with inventories now having increased continuously since mid‑June. The pull of material into the US has begun to generate shortages elsewhere, with the LME backwardation between immediate and three‑month delivery reaching its sharpest level since 2021 across the August average, providing further support to prices. Additional support came from severe winter storms in Chile, which caused road closures, power outages and operational disruptions across several copper mines, although these disruptions are expected to normalise in the second half of the year. South‑East Asian demand, initially expected to soften amid elevated energy costs, has also remained resilient, supported by accelerated investment in electricity networks, renewable energy capacity and EV supply chain localisation.
After reaching a new record high in early September, copper prices fell sharply following reports that the US government's decision on tariff implementation had stalled. Concerns in Washington that higher copper prices could increase manufacturing costs in an already elevated cost environment have begun to outweigh the potential benefits of encouraging domestic mining. Recent price action highlights the extent to which copper has become driven by policy developments. As a result, we continue to view the future path of the red metal as highly dependent on any forthcoming tariff announcements. Regardless, we expect prices to remain elevated through the remainder of 2026. Ongoing electrification trends following the latest energy shock, together with robust AI and data‑centre investment, should continue to support demand, while cautious COMEX inventory accumulation is likely to persist. Against this backdrop, we expect LME copper to average US$14,810/t in Q4.
The medium‑term outlook is likely to become more challenging. While the eventual outcome of the Section 232 is likely to weigh on prices, a softer demand impulse appears more plausible than a flood of supply returning from the US, with accumulated inventories likely to be consumed domestically. China's property sector also remains under pressure, with fixed asset investment falling 6.7%ytd in July, highlighting an important source of ongoing lost demand, while incremental mine supply is expected to place further downward pressure on the market. However, structural electrification trends and manufacturing localisation should provide a floor under prices, with a trough of around US$12,750/t expected by end‑2028. Beyond this point, prices are expected to strengthen as net‑zero targets approach, EV uptake gathers momentum, renewable deployment accelerates and expanding data‑centre investment drives additional demand for energy generation and transmission infrastructure.
Aluminium market tightness compounded by rising alumina prices
Aluminium prices returned to growth in August, rising 3.1%mth. Continued disruption to flows through the Strait of Hormuz has maintained upward pressure on the market, with the Gulf region accounting for around 9% of global smelting capacity and a considerably larger share of global trade. IAI statistics indicate GCC production in July remained 44.0%yr below July 2025 levels, while African production was down 31.1%yr as the Mozal refinery in Mozambique remains under care and maintenance. Given the time‑ and capital‑intensive nature of restarting Gulf smelting capacity, combined with the ongoing loss of African supply from Mozal, we expect market tightness to persist through the remainder of 2026. Indeed, Emirates Global Aluminium (EGA) reported that its Al Taweelah site in the UAE had restarted only 25% of production cells as at end‑August, although it remains on track for a full restart by Q1 2027, while Alba in Bahrain continues to operate below capacity. Additional near‑term support is expected from China, where output increased by just 2.7%yr in July, far from offsetting losses in the Gulf and Africa. Production growth also remains constrained by China's capacity replacement policy, whereby any new capacity must be matched by the permanent closure of approved existing capacity to limit overcapacity, energy consumption and pollution. The collapse of US–Canada trade negotiations has added another layer of uncertainty to aluminium markets. While the tariffs are unlikely to materially alter global supply, they may redirect Canadian metal towards Europe and widen regional premiums.
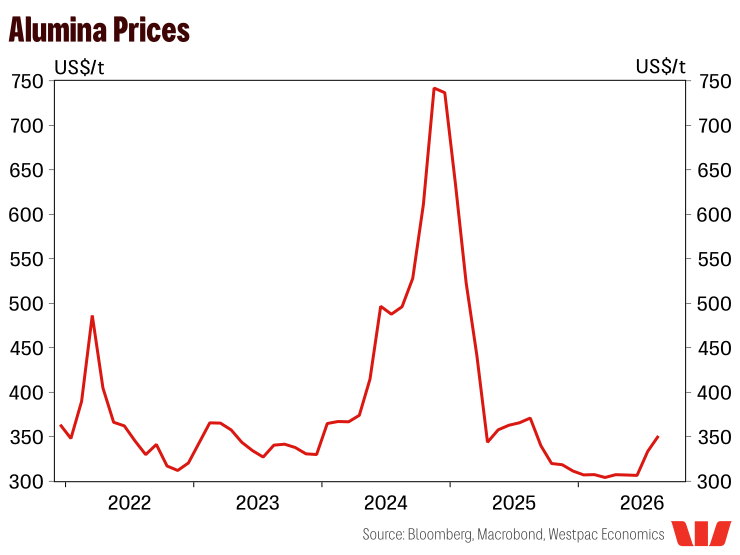
Further, alumina prices have risen through August and September, exceeding US$350/t, their highest level since August 2025. The increase reflects Alcoa lowering its 2026 alumina production guidance by 200–300kt due to operational disruptions at one of its Western Australian refineries, while Alunorte has reduced output by 100–120kt following earlier disruptions to gas supply.
Against this backdrop, we expect aluminium prices to remain supported, although we do not anticipate a full return of the war premium, with higher prices incentivising some capacity restarts across Western economies and South-East Asia. Even so, market conditions are likely to remain tight into Q1 2027, with prices forecast to peak at an average of US$3,330/t. Thereafter, prices are expected to ease as supply stabilises, Gulf producers restore production and new Indonesian capacity comes online. Longer-term support is expected to come from EV, grid infrastructure and data-centre investment, while growing competition for power from data centres may constrain future smelting capacity expansion.
Lithium supported by structural demand despite supply uncertainty
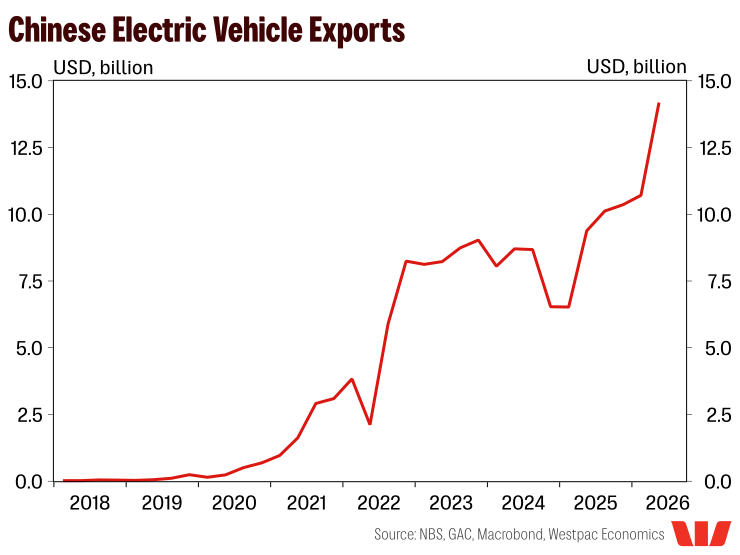
The lithium market has transitioned towards a more balanced position from the oversupply environment of 2024–25, with spodumene (6% FOB Australia) prices stabilising in the US$2,000–3,000/t range. Spodumene prices continued to soften from their May highs, falling 4.7%mth in August as stronger battery storage demand was unable to offset growing uncertainty surrounding the return of curtailed supply. Despite this, the outlook remains constructive. Near-term support is expected to persist as downstream users maintain lean inventory positions amid historically volatile prices, while recent fuel insecurity continues to encourage investment in energy storage solutions. Additional support is likely to come from accelerating global EV adoption, with electric vehicles projected by the IEA to account for 28% of global vehicle sales in 2026 and displace 5mb/d of oil demand by 2030. Unlike earlier in the cycle, the EV market is now sufficiently mature for fuel price dynamics to influence purchasing decisions, with lower-cost Chinese EVs continuing to gain market share and accounting for 60% of global EV sales in 2025.
Over the medium to longer term, lithium demand is expected to remain underpinned by structural electrification trends. EVs will continue to be the primary source of demand, with sodium-ion battery chemistries unlikely to meaningfully challenge lithium's dominance given their lower energy density and higher weight. Growth in battery energy storage systems (BESS) is also expected to accelerate alongside expanding renewable generation, with the IEA identifying BESS as the fastest-growing power technology globally. The increasing prevalence of data centres should provide an additional source of demand for energy storage as operators seek to alleviate transmission constraints and manage peak electricity loads.
Lithium is also becoming increasingly important from a strategic and geopolitical perspective. Growing efforts by Western economies to reduce reliance on Chinese critical mineral supply chains, including the Trump Administration's recent US$3bn investment package for critical minerals and battery projects, underscore the importance of securing reliable sources of supply. In this environment, Australia is well positioned as a key supplier of lithium feedstock and battery materials. On the supply side, expanding production, particularly from Australia, should allow the country to capture a larger share of growing global demand, though the benefits are likely to accrue through higher export volumes rather than materially higher prices.
Stay informed with Westpac IQ
Get the latest reports straight to your inbox.
Related articles
Commodities Update August 2026
Commodities Update July 2026
Commodities Update June 2026
Browse topics
Disclaimer
©2026 Westpac Banking Corporation ABN 33 007 457 141 (including where acting under any of its Westpac, St George, Bank of Melbourne or BankSA brands, collectively, “Westpac”). References to the “Westpac Group” are to Westpac and its subsidiaries and includes the directors, employees and representatives of Westpac and its subsidiaries.
Things you should know
We respect your privacy: You can view the New Zealand Privacy Policy here, or the Australian Group Privacy Statement here. Each time someone visits our site, data is captured so that we can accurately evaluate the quality of our content and make improvements for you. We may at times use technology to capture data about you to help us to better understand you and your needs, including potentially for the purposes of assessing your individual reading habits and interests to allow us to provide suggestions regarding other reading material which may be suitable for you.
This information, unless specifically indicated otherwise, is under copyright of the Westpac Group. None of the material, nor its contents, nor any copy of it, may be altered in any way, transmitted to, copied of distributed to any other party without the prior written permission of the Westpac Group.
Disclaimer
This information has been prepared by Westpac and is intended for information purposes only. It is not intended to reflect any recommendation or financial advice and investment decisions should not be based on it. This information does not constitute an offer, a solicitation of an offer, or an inducement to subscribe for, purchase or sell any financial instrument or to enter into a legally binding contract. To the extent that this information contains any general advice, it has been prepared without taking into account your objectives, financial situation or needs and before acting on it you should consider the appropriateness of the advice. Certain types of transactions, including those involving futures, options and high yield securities give rise to substantial risk and are not suitable for all investors. We recommend that you seek your own independent legal or financial advice before proceeding with any investment decision.
This information may contain material provided by third parties. While such material is published with the necessary permission none of Westpac or its related entities accepts any responsibility for the accuracy or completeness of any such material. Although we have made every effort to ensure this information is free from error, none of Westpac or its related entities warrants the accuracy, adequacy or completeness of this information, or otherwise endorses it in any way. Except where contrary to law, Westpac Group intend by this notice to exclude liability for this information. This information is subject to change without notice and none of Westpac or its related entities is under any obligation to update this information or correct any inaccuracy which may become apparent at a later date. This information may contain or incorporate by reference forward-looking statements. The words “believe”, “anticipate”, “expect”, “intend”, “plan”, “predict”, “continue”, “assume”, “positioned”, “may”, “will”, “should”, “shall”, “risk” and other similar expressions that are predictions of or indicate future events and future trends identify forward-looking statements. These forward-looking statements include all matters that are not historical facts. Past performance is not a reliable indicator of future performance, nor are forecasts of future performance. Whilst every effort has been taken to ensure that the assumptions on which any forecasts are based are reasonable, the forecasts may be affected by incorrect assumptions or by known or unknown risks and uncertainties. The ultimate outcomes may differ substantially from any forecasts.
Conflicts of Interest: In the normal course of offering banking products and services to its clients, the Westpac Group may act in several capacities (including issuer, market maker, underwriter, distributor, swap counterparty and calculation agent) simultaneously with respect to a financial instrument, giving rise to potential conflicts of interest which may impact the performance of a financial instrument. The Westpac Group may at any time transact or hold a position (including hedging and trading positions) for its own account or the account of a client in any financial instrument which may impact the performance of that financial instrument.
Author(s) disclaimer and declaration: The author(s) confirms that (a) no part of his/her compensation was, is, or will be, directly or indirectly, related to any views or (if applicable) recommendations expressed in this material; (b) this material accurately reflects his/her personal views about the financial products, companies or issuers (if applicable) and is based on sources reasonably believed to be reliable and accurate; (c) to the best of the author’s knowledge, they are not in receipt of inside information and this material does not contain inside information; and (d) no other part of the Westpac Group has made any attempt to influence this material.
Further important information regarding sustainability-related content: This material may contain statements relating to environmental, social and governance (ESG) topics. These are subject to known and unknown risks, and there are significant uncertainties, limitations, risks and assumptions in the metrics, modelling, data, scenarios, reporting and analysis on which the statements rely. In particular, these areas are rapidly evolving and maturing, and there are variations in approaches and common standards and practice, as well as uncertainty around future related policy and legislation. Some material may include information derived from publicly available sources that have not been independently verified. No representation or warranty is made as to the accuracy, completeness or reliability of the information. There is a risk that the analysis, estimates, judgements, assumptions, views, models, scenarios or projections used may turn out to be incorrect. These risks may cause actual outcomes to differ materially from those expressed or implied. The ESG-related statements in this material do not constitute advice, nor are they guarantees or predictions of future performance, and Westpac gives no representation, warranty or assurance (including as to the quality, accuracy or completeness of the statements). You should seek your own independent advice.
Additional country disclosures:
Australia: Westpac holds an Australian Financial Services Licence (No. 233714). You can access Westpac’s Financial Services Guide here or request a copy from your Westpac point of contact. To the extent that this information contains any general advice, it has been prepared without taking into account your objectives, financial situation or needs and before acting on it you should consider the appropriateness of the advice.
New Zealand: In New Zealand, Westpac Institutional Bank refers to the brand under which products and services are provided by either Westpac (NZ division) or Westpac New Zealand Limited (company number 1763882), the New Zealand incorporated subsidiary of Westpac ("WNZL"). Any product or service made available by WNZL does not represent an offer from Westpac or any of its subsidiaries (other than WNZL). Neither Westpac nor its other subsidiaries guarantee or otherwise support the performance of WNZL in respect of any such product. WNZL is not an authorised deposit-taking institution for the purposes of Australian prudential standards. The current disclosure statements for the New Zealand branch of Westpac and WNZL can be obtained at the internet address www.westpac.co.nz.
Singapore: This material has been prepared and issued for distribution in Singapore to institutional investors, accredited investors and expert investors (as defined in the applicable Singapore laws and regulations) only. Recipients of this material in Singapore should contact Westpac Singapore Branch in respect of any matters arising from, or in connection with, this material. Westpac Singapore Branch holds a wholesale banking licence and is subject to supervision by the Monetary Authority of Singapore.
Fiji: Unless otherwise specified, the products and services for Westpac Fiji are available from www.westpac.com.fj © Westpac Banking Corporation ABN 33 007 457 141. This information does not take your personal circumstances into account and before acting on it you should consider the appropriateness of the information for your financial situation. Westpac Banking Corporation ABN 33 007 457 141 is incorporated in NSW Australia and registered as a branch in Fiji. The liability of its members is limited.
Papua New Guinea: Unless otherwise specified, the products and services for Westpac PNG are available from www.westpac.com.pg © Westpac Banking Corporation ABN 33 007 457 141. This information does not take your personal circumstances into account and before acting on it you should consider the appropriateness of the information for your financial situation. Westpac Banking Corporation ABN 33 007 457 141 is incorporated in NSW Australia. Westpac is represented in Papua New Guinea by Westpac Bank - PNG - Limited. The liability of its members is limited.
U.S.: Westpac operates in the United States of America as a federally licensed branch, regulated by the Office of the Comptroller of the Currency. Westpac is also registered with the US Commodity Futures Trading Commission (“CFTC”) as a Swap Dealer, but is neither registered as, or affiliated with, a Futures Commission Merchant registered with the US CFTC. The services and products referenced above are not insured by the Federal Deposit Insurance Corporation (“FDIC”). Westpac Capital Markets, LLC (‘WCM’), a wholly-owned subsidiary of Westpac, is a broker-dealer registered under the U.S. Securities Exchange Act of 1934 (‘the Exchange Act’) and member of the Financial Industry Regulatory Authority (‘FINRA’). In accordance with APRA's Prudential Standard 222 'Association with Related Entities', Westpac does not stand behind WCM other than as provided for in certain legal agreements between Westpac and WCM and obligations of WCM do not represent liabilities of Westpac.
This communication is provided for distribution to U.S. institutional investors in reliance on the exemption from registration provided by Rule 15a-6 under the Exchange Act and is not subject to all of the independence and disclosure standards applicable to debt research reports prepared for retail investors in the United States. WCM is the U.S. distributor of this communication and accepts responsibility for the contents of this communication. Transactions by U.S. customers of any securities referenced herein should be effected through WCM. All disclaimers set out with respect to Westpac apply equally to WCM. If you would like to speak to someone regarding any security mentioned herein, please contact WCM on +1 212 389 1269. Investing in any non-U.S. securities or related financial instruments mentioned in this communication may present certain risks. The securities of non-U.S. issuers may not be registered with, or be subject to the regulations of, the SEC in the United States. Information on such non-U.S. securities or related financial instruments may be limited. Non-U.S. companies may not be subject to audit and reporting standards and regulatory requirements comparable to those in effect in the United States. The value of any investment or income from any securities or related derivative instruments denominated in a currency other than U.S. dollars is subject to exchange rate fluctuations that may have a positive or adverse effect on the value of or income from such securities or related derivative instruments.
The author of this communication is employed by Westpac and is not registered or qualified as a research analyst, representative, or associated person of WCM or any other U.S. broker-dealer under the rules of FINRA, any other U.S. self-regulatory organisation, or the laws, rules or regulations of any State. Unless otherwise specifically stated, the views expressed herein are solely those of the author and may differ from the information, views or analysis expressed by Westpac and/or its affiliates.
UK: The London branch of Westpac is authorised in the United Kingdom by the Prudential Regulation Authority (PRA) and is subject to regulation by the Financial Conduct Authority (FCA) and limited regulation by the PRA (Financial Services Register number: 124586). The London branch of Westpac is registered at Companies House as a branch established in the United Kingdom (Branch No. BR000106). Details about the extent of the regulation of Westpac’s London branch by the PRA are available from us on request.
This communication is not being made to or distributed to, and must not be passed on to, the general public in the United Kingdom. Rather, this communication is being made only to and is directed at (a) those persons falling within the definition of Investment Professionals (set out in Article 19(5) of the Financial Services and Markets Act 2000 (Financial Promotion) Order 2005 (the “Order”)); (b) those persons falling within the definition of high net worth companies, unincorporated associations etc. (set out in Article 49(2)of the Order; (c) other persons to whom it may lawfully be communicated in accordance with the Order or (d) any persons to whom it may otherwise lawfully be made (all such persons together being referred to as “relevant persons”). Any person who is not a relevant person should not act or rely on this communication or any of its contents. In the same way, the information contained in this communication is intended for “eligible counterparties” and “professional clients” as defined by the rules of the Financial Conduct Authority and is not intended for “retail clients”. Westpac expressly prohibits you from passing on the information in this communication to any third party.
European Economic Area (“EEA”): This material may be distributed to you by either: (i) Westpac directly, or (ii) Westpac Europe GmbH (“WEG”) under a sub-licensing arrangement. WEG has not edited or otherwise modified the content of this material. WEG is authorised in Germany by the Federal Financial Supervision Authority (‘BaFin’) and subject to its regulation. WEG’s supervisory authorities are BaFin and the German Federal Bank (‘Deutsche Bundesbank’). WEG is registered with the commercial register (‘Handelsregister’) of the local court of Frankfurt am Main under registration number HRB 118483. In accordance with APRA’s Prudential Standard 222 ‘Association with Related Entities’, Westpac does not stand behind WEG other than as provided for in certain legal agreements (a risk transfer, sub-participation and collateral agreement) between Westpac and WEG and obligations of WEG do not represent liabilities of Westpac. Any product or service made available by WEG does not represent an offer from Westpac or any of its subsidiaries (other than WEG). All disclaimers set out with respect to Westpac apply equally to WEG.
This communication is not intended for distribution to, or use by any person or entity in any jurisdiction or country where such distribution or use would be contrary to local law or regulation.
This communication contains general commentary, research, and market colour. The communication does not constitute investment advice. The material may contain an ‘investment recommendation’ and/or ‘information recommending or suggesting an investment’, both as defined in Regulation (EU) No 596/2014 (including as applicable in the United Kingdom) (“MAR”). In accordance with the relevant provisions of MAR, reasonable care has been taken to ensure that the material has been objectively presented and that interests or conflicts of interest of the sender concerning the financial instruments to which that information relates have been disclosed.
Investment recommendations must be read alongside the specific disclosure which accompanies them and the general disclosure which can be found here. Such disclosure fulfils certain additional information requirements of MAR and associated delegated legislation and by accepting this communication you acknowledge that you are aware of the existence of such additional disclosure and its contents.
To the extent this communication comprises an investment recommendation it is classified as non-independent research. It has not been prepared in accordance with legal requirements designed to promote the independence of investment research and therefore constitutes a marketing communication. Further, this communication is not subject to any prohibition on dealing ahead of the dissemination of investment research.