The supply-side outlook is improving as capital deepening strengthens, reallocation drags fade and AI diffusion gathers pace.
The supply-side outlook is looking brighter. A pickup in capital deepening and a fading ‘reallocation’ drag are already evident in the Annual National Accounts, with AI diffusion offering further upside. This gives us greater conviction that productivity growth can return towards 1% or more over time, above the RBA’s assumption and closer to Treasury’s. The recovery illustrates why it is important to focus on longer-term trends in productivity growth rather than on the latest year or two, which can be volatile.
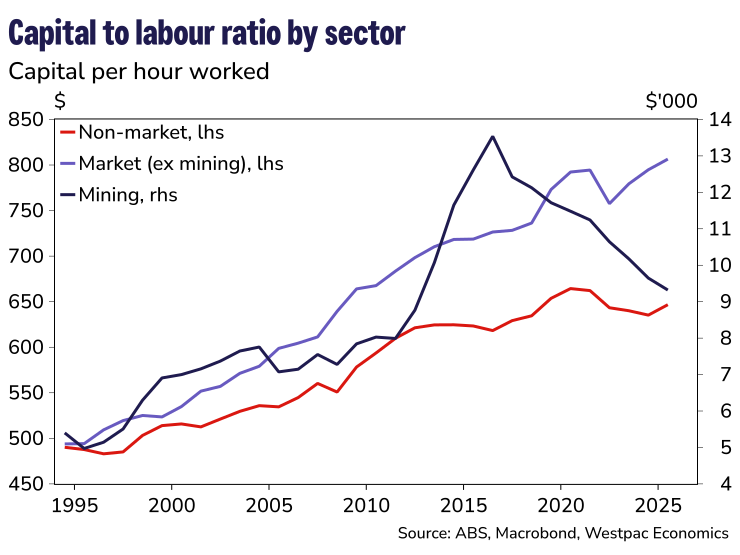
Capital deepening is returning. Investment is picking up and, outside mining, market-sector capital per hour worked is now at a record high, rising a strong 1.5% in 2025–26.
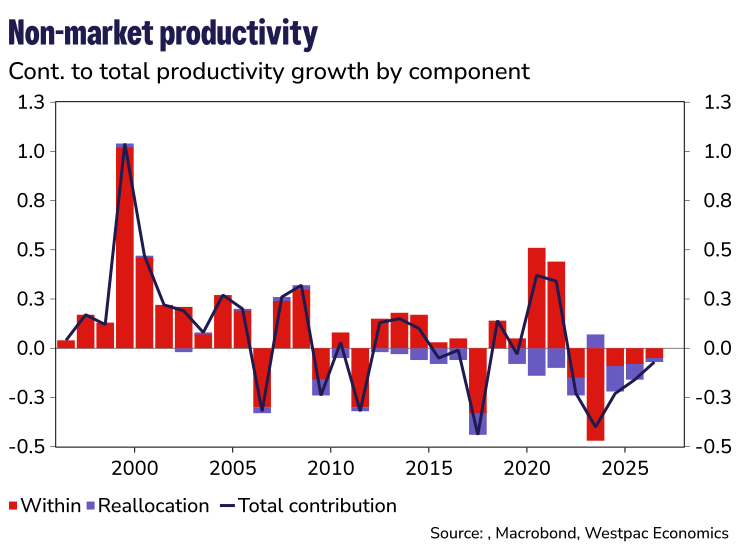
The reallocation headwind is easing. The shift of labour towards non-market industries, which generally have lower measured productivity levels, has reduced the level of aggregate productivity by around 1ppt over the past 15 years. With the expansion of the non-market sector plateauing, this drag looks set to fade.
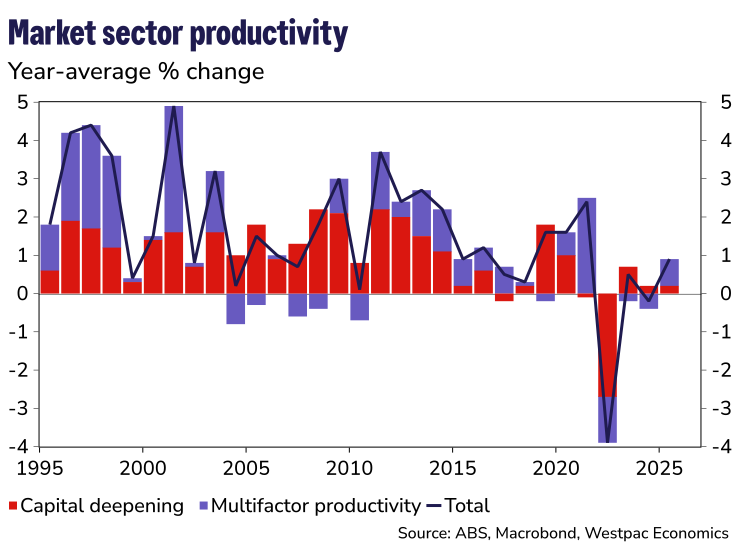
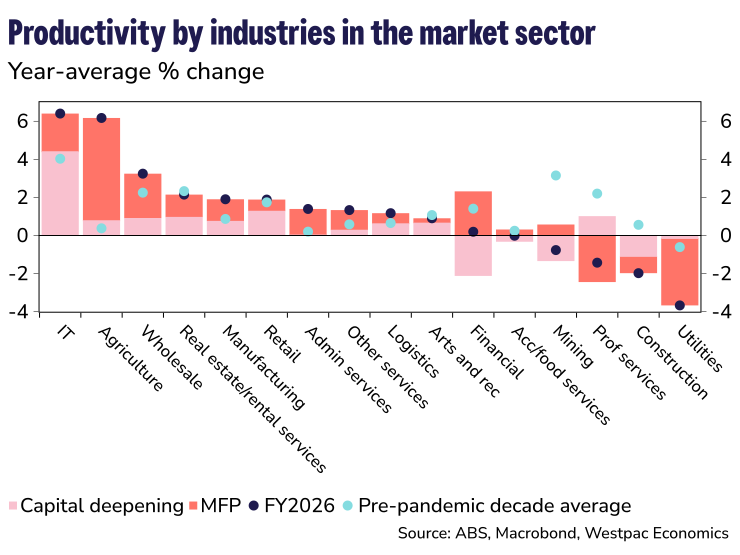
Productivity growth is about more than capital. Multifactor productivity, which captures how efficiently businesses combine labour and capital, was the dominant driver of market-sector productivity growth in 2025–26. Meanwhile, stronger investment in IT, utilities and professional services should provide a further lift as new capital is put to work.
Growth in 2024-25 was a little firmer than first thought
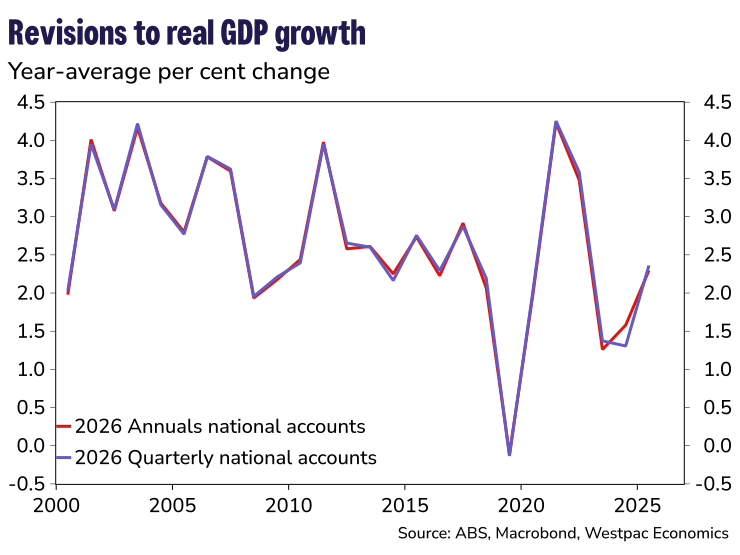
The 2025–26 figures show somewhat firmer economic activity and business investment than previously estimated, particularly in 2024–25. The economy grew by 2.3% in year-average terms, broadly in line with the initial quarterly National Accounts estimate of 2.4%. However, growth in 2024–25 was revised up by 0.3ppts to 1.6%, largely reflecting stronger private business investment. Business investment is now estimated to have increased by 1.1% in 2024–25, compared with the initial estimate of a 0.2% decline. The revisions do not materially alter the broader productivity story, but they do suggest that the economy was growing a little more strongly for the same rate of inflation in 2025.
The investment upswing is broadening
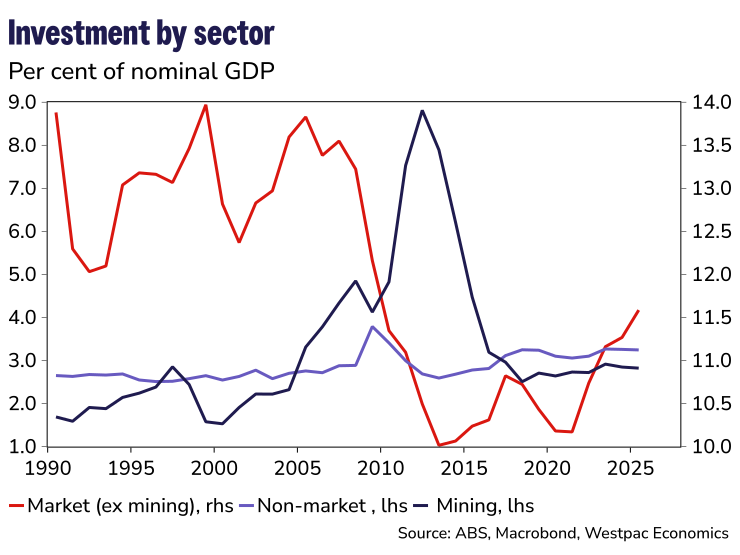
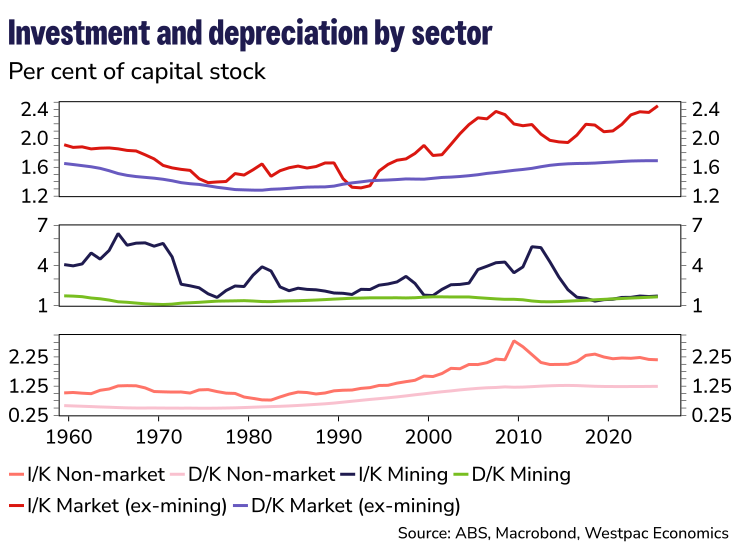
The Annuals also provide a richer picture of the supply side, including investment by industry and the evolution of the capital stock, details that are not available in the quarterly accounts. These data point to a notable lift in investment in the market (ex-mining) part of the economy, where investment has gone from around 10% of nominal GDP in to just over 11.5%. Outside of this, investment has been softer, particularly in the mining sector.
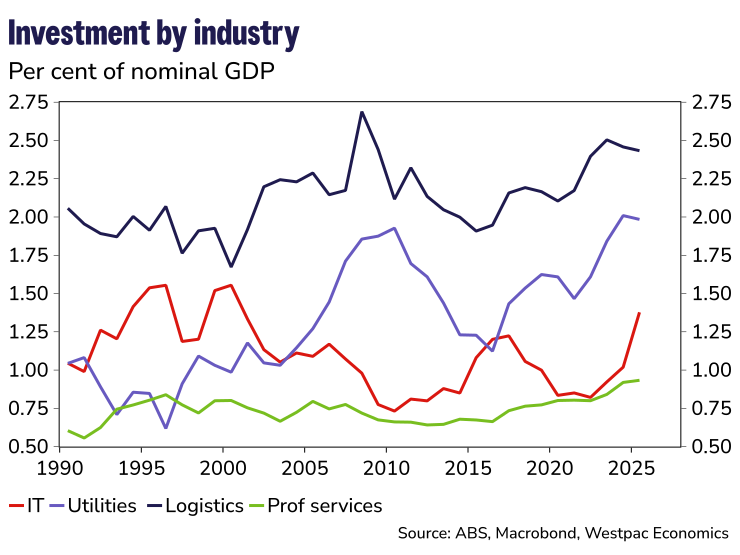
Within the market sector, investment by the IT industry, increasingly focused on data centres, has risen to its highest share of nominal GDP since the technology boom of the 1990s. Utilities investment, including renewables and associated infrastructure, is stronger still, at its highest share since 1983, while investment by the professional services industry has reached a record high.
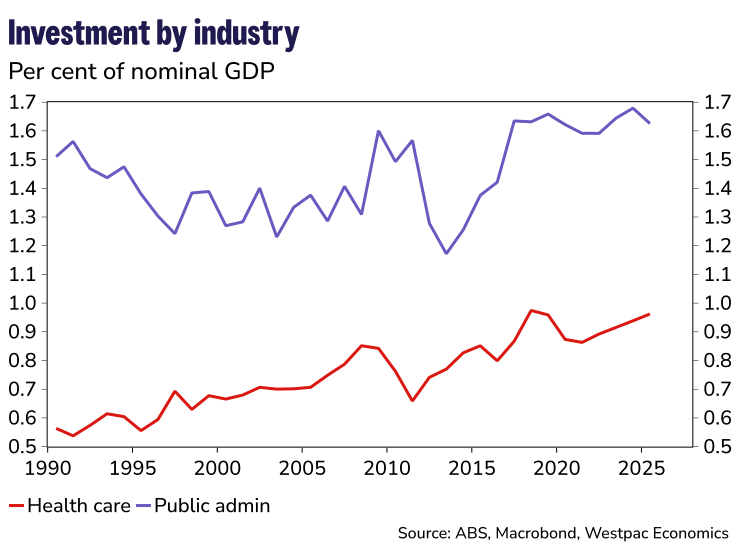
Across the non-market sector (including health, education and public administration), investment has also held at a higher share of the economy, driven by the health and public administration (including defence) industries.
Investment is translating into capital deepening
The investment upswing is also beginning to translate into capital deepening as industries look to rebuild capital stocks after a period of soft growth. Outside mining, market-sector capital per hour worked is at a record high and well above its pre-pandemic level. That is an encouraging development, particularly given that the sector accounts for 70% of total employment.
There are important divergences beneath the aggregate. Mining continues to experience capital shallowing, as investment has been insufficient to cover wear and tear and capital requirements associated with additional workers. By contrast, the capital stock in the non-market sector appears to have caught up with the surge in employment we have seen since the pandemic, with capital per worker increasing for the first time since the pandemic.
A major productivity headwind is starting to fade
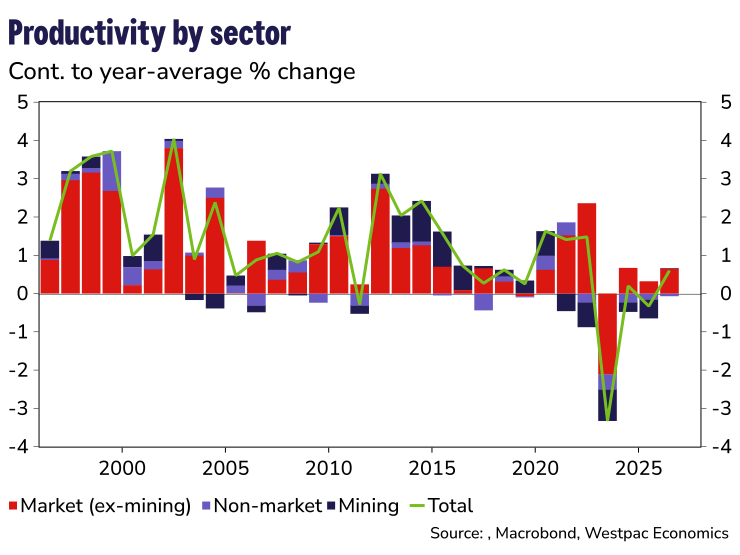
Capital deepening will help support productivity growth across the economy. The Annuals show that productivity in the market sector (excluding mining) continues to grow by around 1% in year-average terms, while mining remains a drag on aggregate productivity (down 0.8% in 2025–26 and almost 30% since 2017).
At the same time, a major recent headwind is easing as the rapid expansion of the non-market sector approaches slows. This matters for aggregate productivity. Productivity growth reflects both gains within industries, through capital deepening, technology and better processes, and the ‘reallocation’ of resources between industries with different productivity levels.
Measured productivity in the non-market sector is considerably lower than across much of the market economy, partly reflecting measurement issues (output in these sectors is generally not well measured, particularly when there are quality changes). As employment shifted towards these industries, this compositional effect weighed on aggregate productivity. Our estimates suggest it has reduced the level of aggregate productivity by a significant 1ppt over the past 15 years and almost 0.3ppts over the three years to 2025–26.
Productivity gains were about more than capital
It wasn’t only capital deepening that drove productivity growth. Multifactor productivity (MFP), which captures how efficiently businesses combine labour and capital through changes in processes, technology, know-how, was the dominant driver of market-sector productivity growth this year. This gives us more conviction that the supply side is normalising, and productivity growth will improve from its recent lows.
Where productivity is improving, and where it isn’t
At the industry level, some of those recording stronger investment are also beginning to deliver stronger productivity outcomes, although the picture remains uneven.
IT stands out at the positive end of the spectrum, alongside improving outcomes in manufacturing, administrative and support services, and transport.. These are also industries where the diffusion of AI and other digital technologies could deliver further productivity gains. Utilities and professional services should also benefit as stronger investment translates into greater capital intensity and efficiency.
At the other end, mining remains a major drag, consistent with the capital shallowing evident in the investment and capital-stock data. Construction is another notable laggard, with productivity continuing to deteriorate despite strong demand from housing, population growth, renewable-energy infrastructure and data-centre projects. Construction productivity fell around 2% in 2025–26 and almost 21% over the 13 years from 2012–13 to 2025–26.
A more constructive supply-side story
The Annuals provide a more constructive supply-side picture than the aggregate productivity figures alone suggest. Market-sector productivity outside mining continues to advance, the reallocation drag from the expanding non-market sector looks likely to fade, and capital deepening is strengthening across important parts of the economy. The strong MFP outcome in the market sector gives us more conviction that the supply side is normalising, and productivity growth will improve going ahead.
The critical question is whether the strong investment underway in technology, professional services, electricity and related infrastructure translates into stronger productivity growth as that new capital is put to work. If it does, the improvement in capital intensity evident in the Annuals could mark the beginning of a more durable lift in Australia’s productivity performance.